Rely on a market-informed guide to identify the largest opportunities
Why use this feature
The new Budget Assessment and Metric Explorer dashboards includes Axiom Comparative Analytics data embedded directly into the Budgeting workflow to provide access to comparative and market-based information while setting and adjusting budgets. This data allows you to create an achievable budget and discover the best strategies to end your fiscal year on target.
NOTE: This feature requires a license for Axiom Comparative Analytics.
How this feature works
What: The Budget Assessment dashboard displays comparative budget charts to help compare your next year budget to peer groups and percentiles for your market or organizational context.
Where: In the Budgeting or Bud Admin task pane, in the Budget Reporting section, double-click Budget Assessment.
Who: Users must be assigned either the Bud Admin or Budget User role along with the Comparative Analytics - Dept role to view the dashboard.
How: Use the filter options on the left side of the page to select your organization’s entity and department to include in the dashboard as well as the peer group to compare your entity and department against.
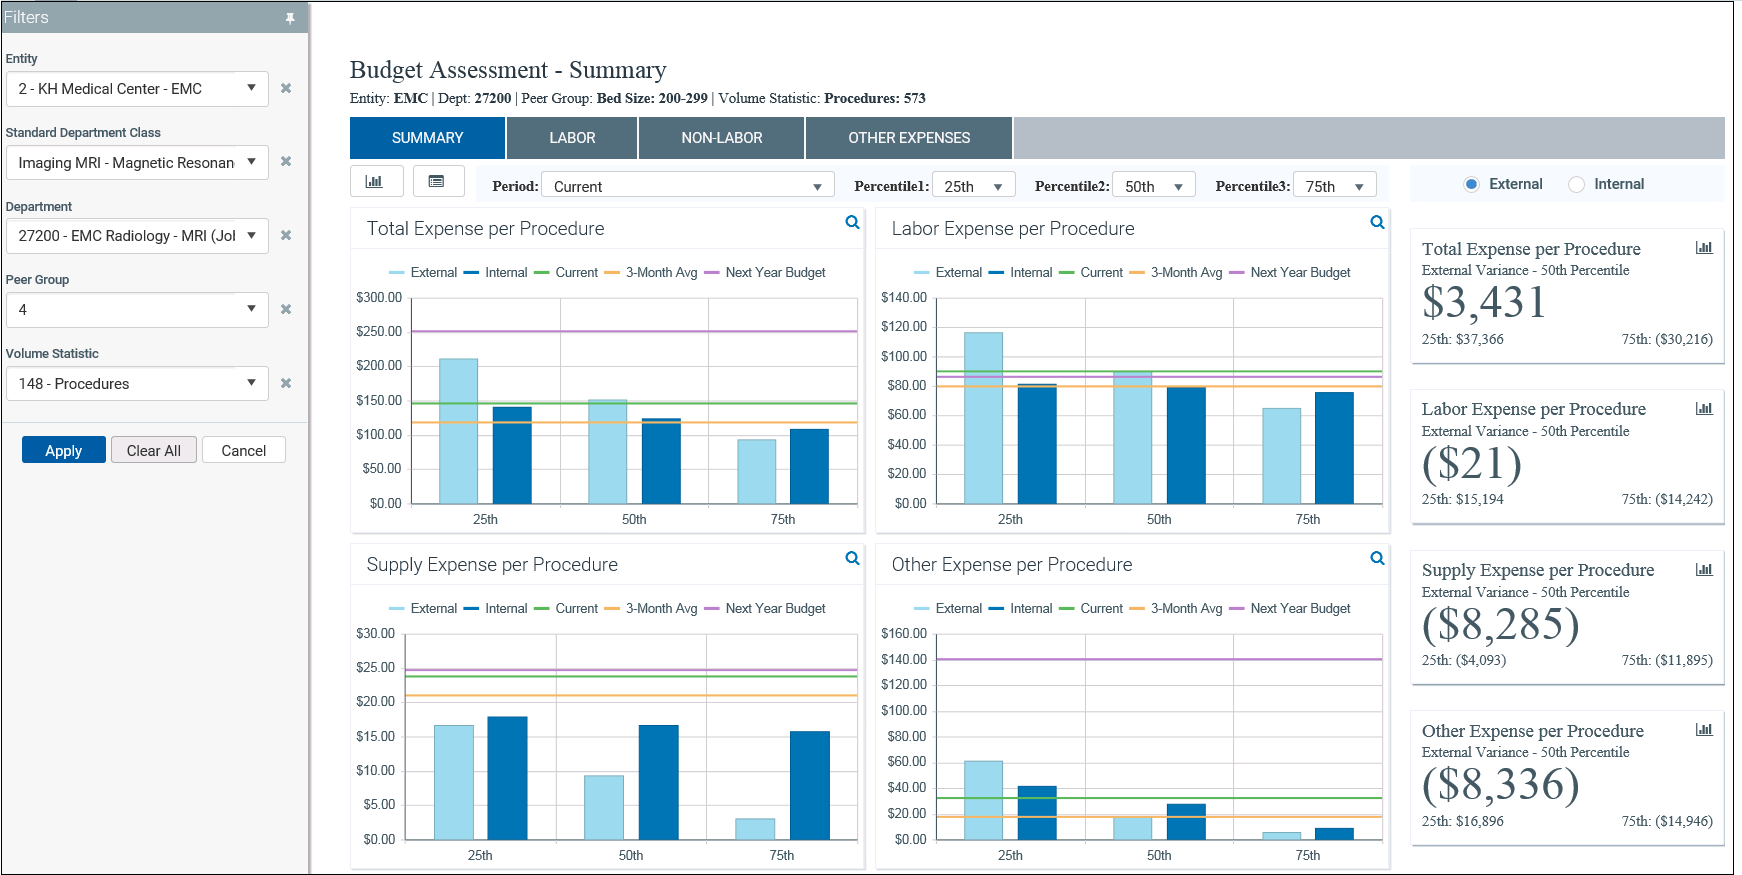
Example of the Budget Assessment dashboard
|
|
Click here to watch a video demonstration |
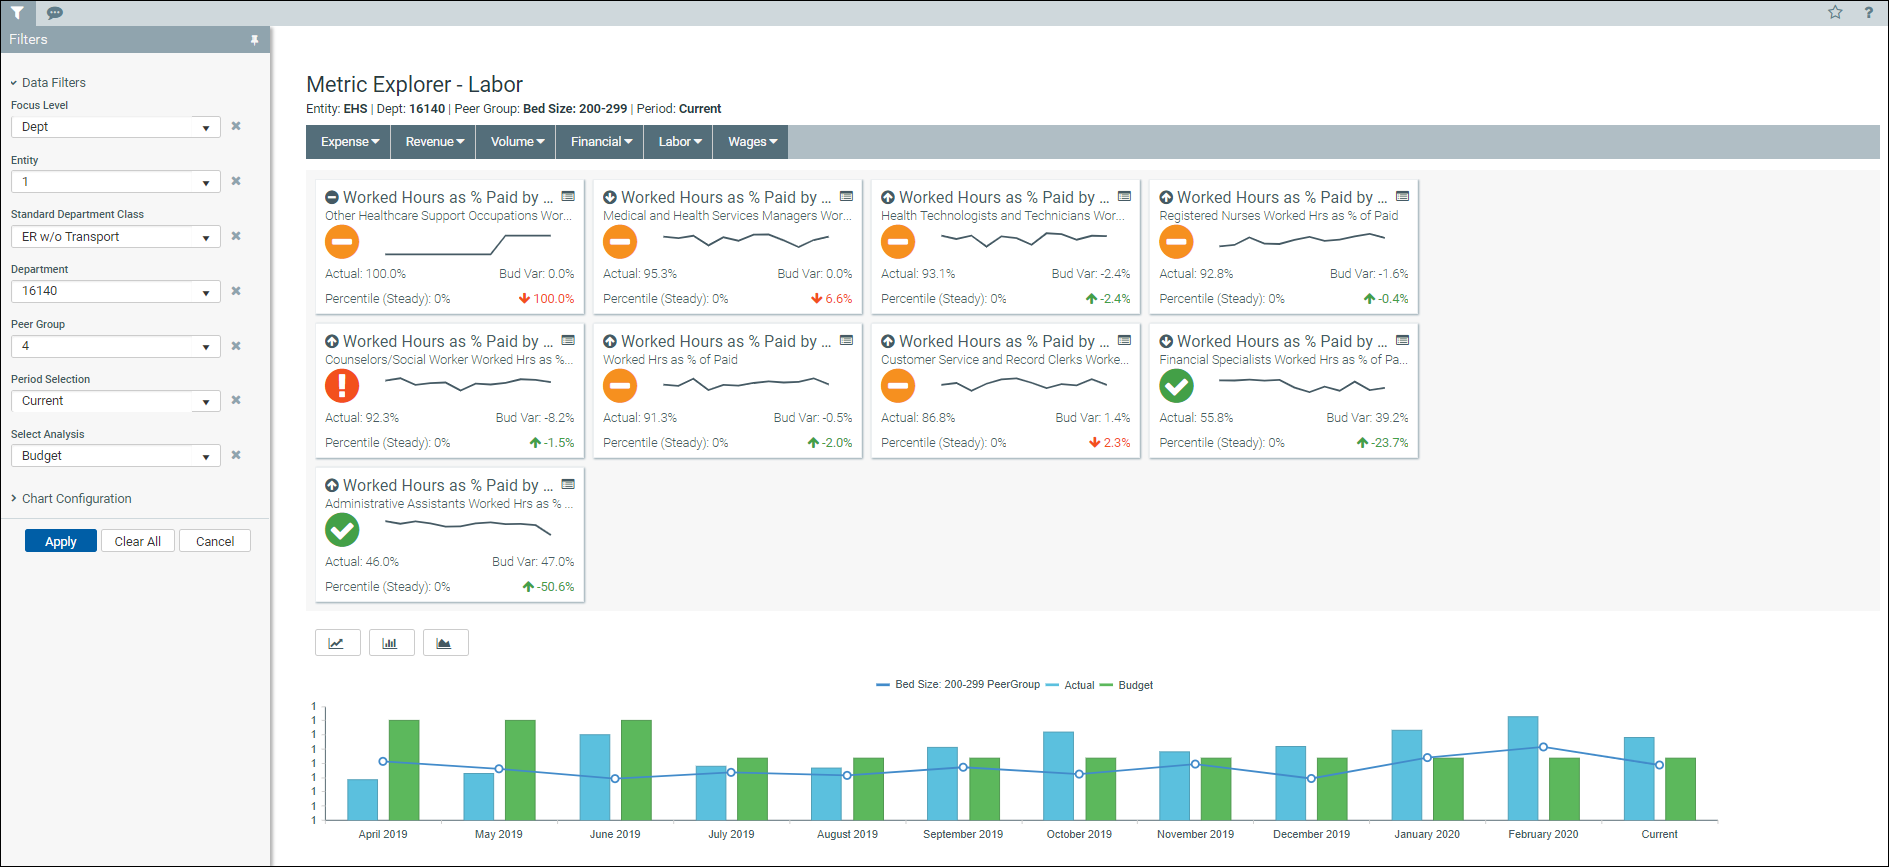
Drill down to details from the Budget Assessment dashboard to the Metric Explorer dashboard
|
|
Click here to watch a video demonstration |
Where to find more information
The following topics in the online help have been updated with information and instructions for using this feature:
